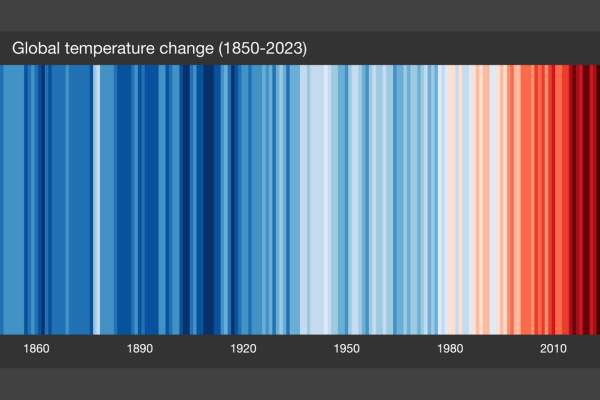
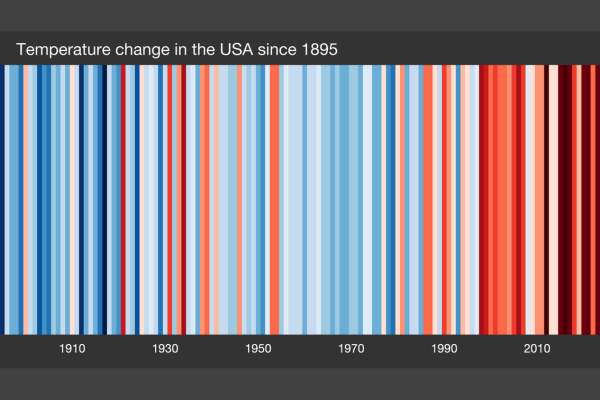
Global temperatures in 2023 were the hottest ever reported. These extreme temperatures are negatively impacting our planet and our health.
These days, it’s easy to believe that global warming is getting serious. Temperatures across the United States – and the world – are reaching peak levels. Heat waves are becoming more frequent, and heat indexes are climbing.
As ClimateCentral notes, over 81% of humans experienced a heat wave at least once in July 2023, with 2 billion people experiencing hazardous heat conditions daily for the duration of the month. Climate scientists warn that the United States will experience three times more extreme heat index days by 2050. A extreme heat index day occurs when the heat index reaches 105 degrees Fahrenheit or more.
Our planet has experienced periods of gradual warming and cooling over millennia. However, humanity’s increasing carbon emissions have caused Earth to warm at a faster rate.
As Michael Mann shares in Our Fragile Moment: How Lessons From Our Past Can Help Us Survive the Climate Crisis, Earth has warmed and cooled several times over the past 4.5 billion years. Climate change warmed the planet enough to make it viable for life, and climate change will eventually push temperatures beyond the fragile conditions required for our survival. Human activity has, unfortunately, accelerated Earth’s natural climate fluctuations.
Studying temperature anomalies is the best way to understand the effect of climate change on our warming planet.
Ed Hawkins, professor and climate scientist at the University of Reading, created the “Warming Stripes” chart to visually represent how temperatures on Earth have fluctuated since the 1850s. This chart uses a blue or red line to indicate whether the temperature for a given year was cooler or warmer than the overall average from 1971-2000.
The Warming Stripes chart tracks temperature anomalies instead of actual temperatures. A temperature anomaly depicts how current temperatures differ from historical averages. The baseline is usually determined by averaging several decades’ worth of temperatures together. Temperature anomalies more accurately measure changes over time and are incredibly helpful for understanding climate change. Discover warming stripes for other countries across the globe on the ShowYourStripes website.
The data collected in the Warming Chart shows just how severely human activity has accelerated Earth’s warming. In fact, scientists are expanding the Warming Chart color scale earlier than anticipated to account for hotter years ahead.
Global temperatures in 2023 were the highest ever recorded. Earth’s overall temperature has increased a striking 1.4 degrees Celsius (2.5 degrees F).
Drag your cursor over the OPL Insight below to explore how global and land temperature anomalies have changed by year since 1900. Anomaly data is in Celsius, with negative temperatures indicating cooler-than-average temperatures and positive numbers indicating hotter-than-average temperatures.
Temperature anomalies help us understand which U.S. states are impacted the most by rising heat indexes caused by climate change.
Our OPL Insight below shows average temperatures for June 2024 compared to the mean temperature from 1901-2000. On the surface, this map shows what you would expect: cooler temperatures up north and hotter temperatures down south.
But now, let’s represent the same data in a different way, using temperature anomalies. As mentioned earlier, temperature anomalies measure the difference between current temperatures and historical averages instead of looking at absolute temperatures.
The map tells a different story if we compare June 2024 temperature anomalies for each state against the mean temperature from 1901-2000. The reddest areas of the map are the areas with the most significant temperature fluctuations. A large part of this area comprises New Mexico and the Colorado River Basin, an area of the country currently suffering severe drought conditions. Unfortunately, human activity is depleting the watersheds that feed the Colorado River, which has caused the collapse of these natural sources. This area is an indicator of our larger global climate crisis and is expected to worsen as climate changes intensify.
Carbon emissions from human activity have made hotter temperatures five times more likely.
The Climate Shift Index (CSI) measures how climate change impacts local daily temperatures. The scale of the index is -5 to +5, with positive numbers indicating how many times more likely temperatures are influenced by climate change. Cities across Colorado, Utah, Texas, Mexico, Alabama, Florida, Georgia, and North Carolina are expected to receive a CSI rating of +5 (the maximum rating) this summer. This proves without a doubt that human activity is significantly affecting climate change, and states are starting to feel it as heat indexes climb.
Rising temperatures are also hazardous for our health.
Exposure to extreme weather can have adverse effects on your heart and other vital organs, no matter your age. Environmental temperatures over 95 degrees Fahrenheit can be dangerous, as your body cannot rely on sweat evaporation to cool itself. High ambient temperatures can lead to heat exhaustion, categorized by weakness, dizziness, headaches, and fainting. In extreme cases, it can lead to heat stroke, which damages the body’s central nervous system and can lead to death if left untreated.
Air pollution also increases during heat waves, which is detrimental for asthma and allergy sufferers. And other health conditions make it even more imperative to stay out of the heat. Certain doctor-prescribed medications, such as metformin (typically prescribed for diabetes), can cause dehydration. Antipsychotic drugs prescribed for schizophrenia and other mental illnesses can inhibit the body’s natural sweat response. It’s no surprise, then, that heat is the world’s most deadly weather-related fatality.

Today, heat is attributed to killing an average of 490,000 people globally and leaving even more with severe health problems.
An analysis from the Natural Resources Defense Council found that more frequent high-heat-index days could cause summertime deaths in America’s urban areas to increase tenfold by the mid-2040s. The World Health Organization warns that deaths attributed to heat are expected to increase worldwide by 50% by 2050. All this is to say: we must take climate change and increases in heat index seriously.
Protect your body against extreme heat to avoid heat stroke and other climate-induced severe illnesses.
If you must be outside in the heat, be sure you’re prepared.
- First and foremost, hydrate! Bring plenty of water with you. A reusable container will help keep your liquids cooler longer.
- Wear proper protective clothing, headgear, and sunscreen. Read our Essential Sun Protection Tips for Every Season to ensure you’re covered.
- Use the National Weather Service’s HeatRisk Tool to assess whether your local forecasted temperatures are unusually high and place you at a greater risk.
- If you anticipate spending extended periods of time outside, it’s a good idea to acclimate your body by gradually spending more time in the heat. Heat acclimatization prevents undue strain on your heart and other vital organs and is especially helpful for people who work outdoors on a regular basis.
The best way to beat the heat is to commit to a sustainable lifestyle.
It takes all of us to combat climate change and reverse the planet’s warming. Every small action you take towards sustainable habits makes a difference. The One Planet Life app can help you commit to a 12-month sustainability journey. Track your Joyful Changes and form lasting greener habits. Join the OPL community as we work together to beat the heat!
Take a deeper dive with these climate-related reads.
Discover More
One Planet Life Insights draw from a vast array of data gathered from the most reputable sources in the world. We curate and compile this rich information into interactive, easy-to-navigate insight maps to help you better understand your community and the world around us.

Written by Kristina Shane
Lead Content Manager and Editor
“I’ve always had a strong inclination to protect and nurture the people and living things around me. Especially after having kids, I became passionate about conserving our planet for future generations. It’s my duty to teach my children, through words and actions, how to be good citizens and thoughtful stewards for our planet. Joining One Planet Life felt like a natural next-step for me, and I’m thrilled to support their mission and strengthen my own sustainability efforts.”


