See how your state stacks up with OPL’s data insights.
One Planet Life’s data insights rank states based on their CO2 emission, air quality, water quality, waste, and overall pollution.
Planet Earth is warming at an alarming rate. Scientists, climate activists, and governments across the globe have recognized the urgency with which we must combat our climate crisis. By 2030, we must reduce our carbon emissions by at least 50%. By 2050, our goal is to be carbon emissions neutral. This means that we do not emit more greenhouse gasses into the atmosphere than the planet can naturally absorb. To measure this change, One Planet Life has developed an interactive data insights dashboard. The dashboard ranks how each state is performing against various factors that affect climate change.
We’ve compiled data points from verified sources to assess each state’s carbon emissions, water quality, waste volume, air quality, and overall pollution. The lower the rating, the better the state is doing in that specific area. And the higher the rating, the more improvement the state needs to make.
Explore the interactive maps below to gain a better understanding of how your state ranks compared to other states for each factor analyzed. We think some rankings may surprise you.
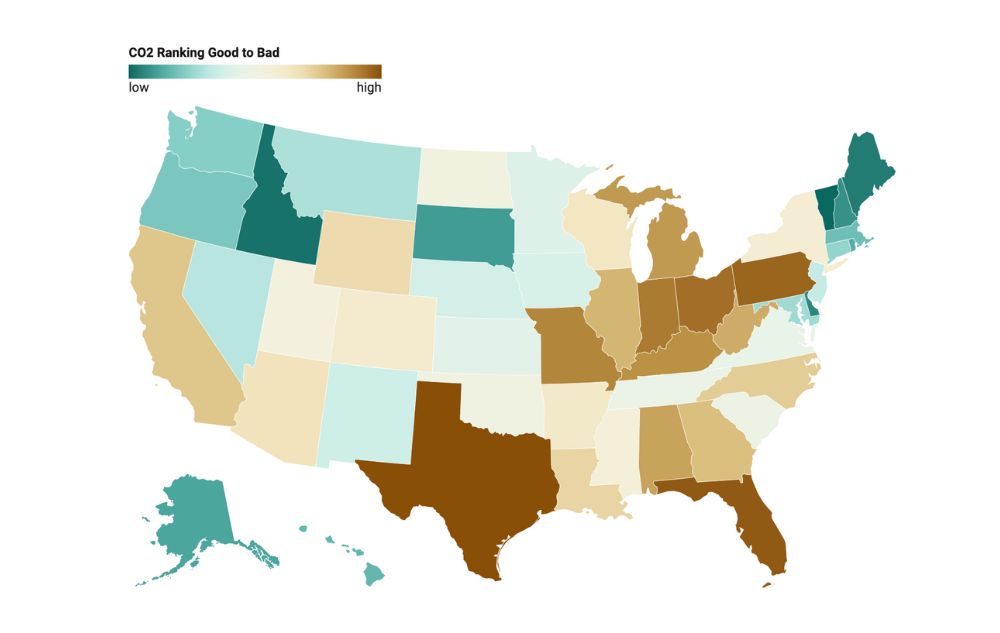
Carbon Emissions
Carbon (CO2) emissions contribute significantly to climate change and air pollution. These emissions refer to the release of carbon dioxide and other gasses created by fossil fuels, livestock, deforestation, industrial processes, power plant emissions, and other human activities that have a negative impact on the environment and the health of its inhabitants.
State carbon emissions are ranked in the interactive dashboard using data provided by the U.S. Environmental Protection Agency and the U.S. Energy Information Administration (EIA).
Air Quality
Air quality refers to the cleanliness of the air we breathe. It can be measured by the Air Quality Index (AQI) which is calculated based on four major air pollutants regulated by the Clean Air Act: ground-level ozone, particle pollution (such as dust and smoke), carbon monoxide, and sulfur dioxide. The AQI index range is 0-500, with 0 representing clean and 500 representing hazardous conditions.
Our interactive dashboard ranking is based on each state’s average Air Quality Index number as reported by the EPA.
Water Quality
The Safe Drinking Water Act (SDWA) of 1974 created regulations to assess the nation’s water supply and its sources. This act also allowed the United States Environmental Protection Agency (EPA) to establish drinking water standards to ensure public safety and protect against naturally occurring and synthetic contaminants. States work with the EPA and water treatment and processing systems to ensure these standards are upheld.
The ranking provided on the interactive dashboard is based on information provided by the EPA. Each state’s ranking is based on the number of drinking water violations that the state has reported.
Overall Pollution
Pollution can be naturally occurring or created by industrial, transportation, waste management, and energy production outputs. It includes various harmful substances like particulate matter (PM), carbon monoxide (CO), ozone (O3), nitrogen dioxide (NO2), sulfur dioxide (SO2), and others. Exposure to these pollutants can cause respiratory diseases, cardiovascular issues, and even cancer.
The interactive dashboard ranks each state based on its toxic chemical pollution levels and the long-term chronic health risks of its population, as reported by US News.
Waste Volume
The United States Environmental Protection Agency (EPA) collects data on the generation and disposal of waste. Their findings reveal that the United States is the world’s most wasteful country, with Americans producing 1,700 pounds of waste per person per year.
One Planet Life’s interactive dashboard ranks states based on the amount of tons of waste that enter landfills per person per state as reported by the EPA.
States with the Best and Worst Climate Rankings:

Learn more about the urgency of climate change and its effects on our world:
Discover More
One Planet Life Insights draw from a vast array of data gathered from the most reputable sources in the world. We curate and compile this rich information into interactive, easy-to-navigate insight maps to help you better understand your community and the world around us.


