Explore OPL Insights: Your Gateway to Sustainable Living
At One Planet Life, we are committed to empowering your eco-journey with data-driven insights that help you reduce your carbon footprint and contribute to a more sustainable world. Our OPL INSIGHTS are meticulously developed by analyzing vast amounts of data from the most reputable sources, including Global Forest Watch, the Grace Communication Foundation, and the United States Geological Survey. We synthesize this information into easy-to-navigate, interactive guides covering essential topics such as climate change, sustainability, food waste, recycling, and wellness. With these exclusive insights, you can make informed decisions that positively impact both your life and the planet. Together, we can drive sustainability efforts and take meaningful steps to address the climate crisis.
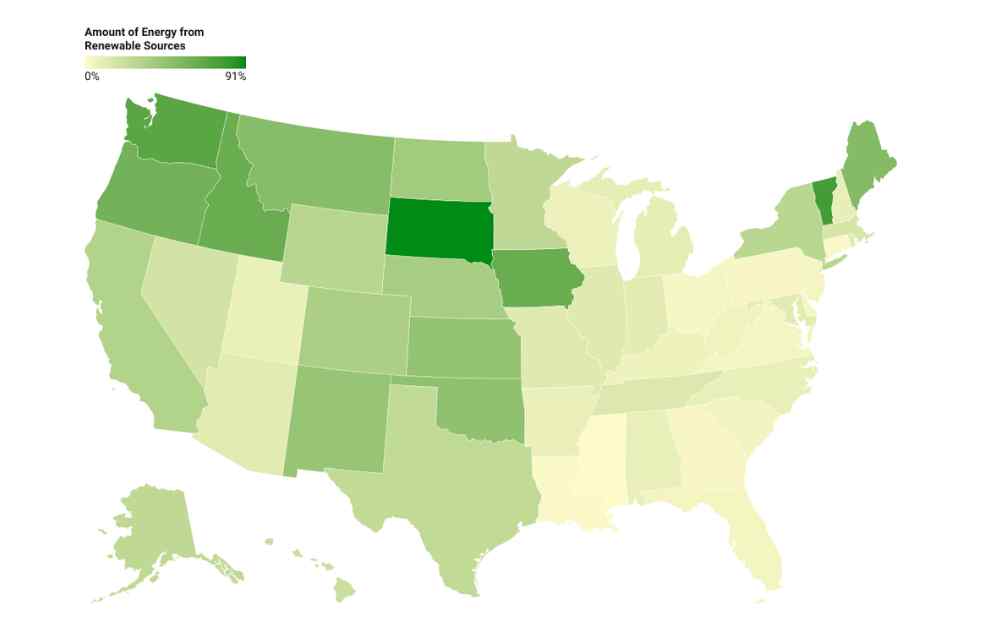
Renewable Energy Percentages in the US
The United States has been working to transition to renewable energy sources like solar and wind for the last several years. While there’s been significant growth in renewable energy generation, these new projects are straining to meet rising energy demands. Discover more about our energy landscape, and which states are leading the way in renewable energy sources.
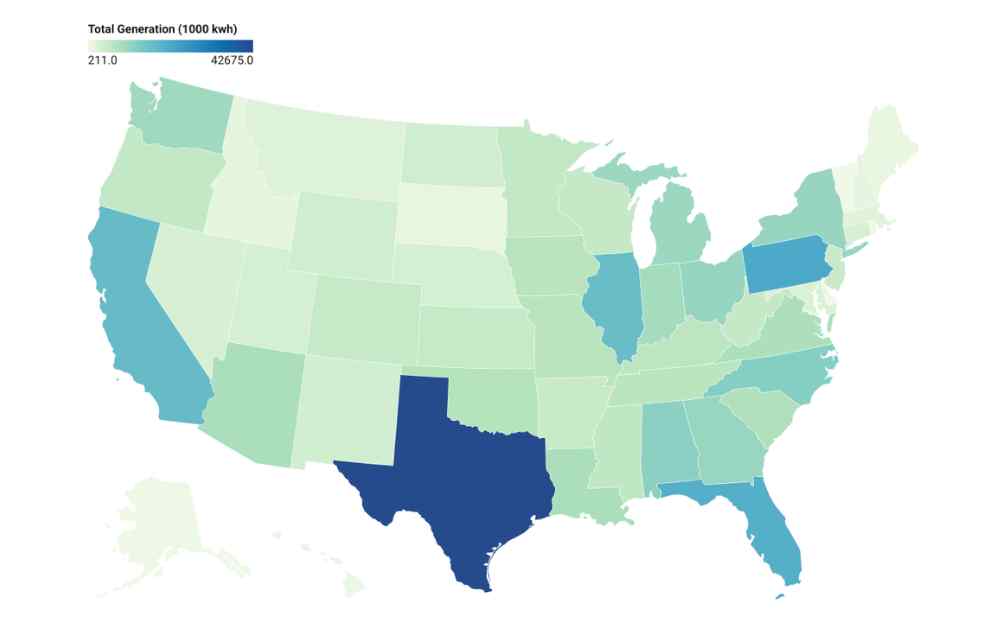
Electricity Generation Mix By State
America’s renewable energy transition projects are straining to meet rapidly rising energy demands. In this OPL Insight, discover which states generate the most electricity. Then, dive deeper to find out which energy sources each state uses to generate their energy.
Biodiversity Around the World
There are over 10 million plant and animal species that share our Earth. Each plays a unique role in nature’s design. Bees and bats pollinate trees and plants, predators control prey, and trees control flooding and moderate our climate.
Our exclusive interactive map provides videos, photos, and other interesting facts about some of the unique species living on our planet.
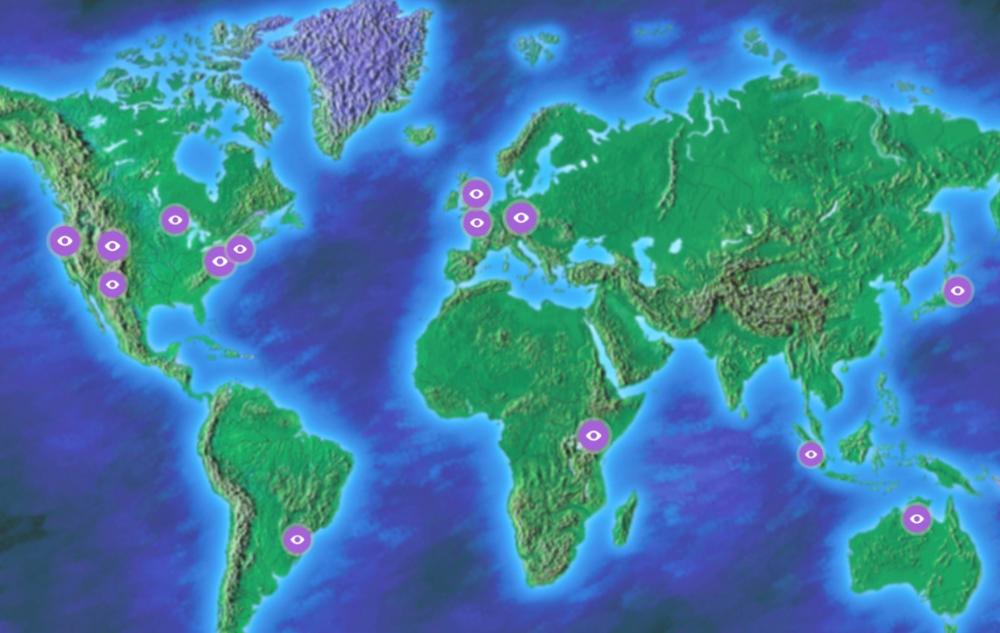
Wildlife Crossings Around the World
Animals are losing access to large parts of their living space, and their migratory patterns are in jeopardy. Without sufficiently-connected habitats, wildife may struggle to find food or mates, placing the species in peril. The good news is efforts have been made to create special-purpose natural wildlife bridges to reconnect natural habitats.
Explore our interactive map to virtually discover wildlife bridges and green crossings across the globe.
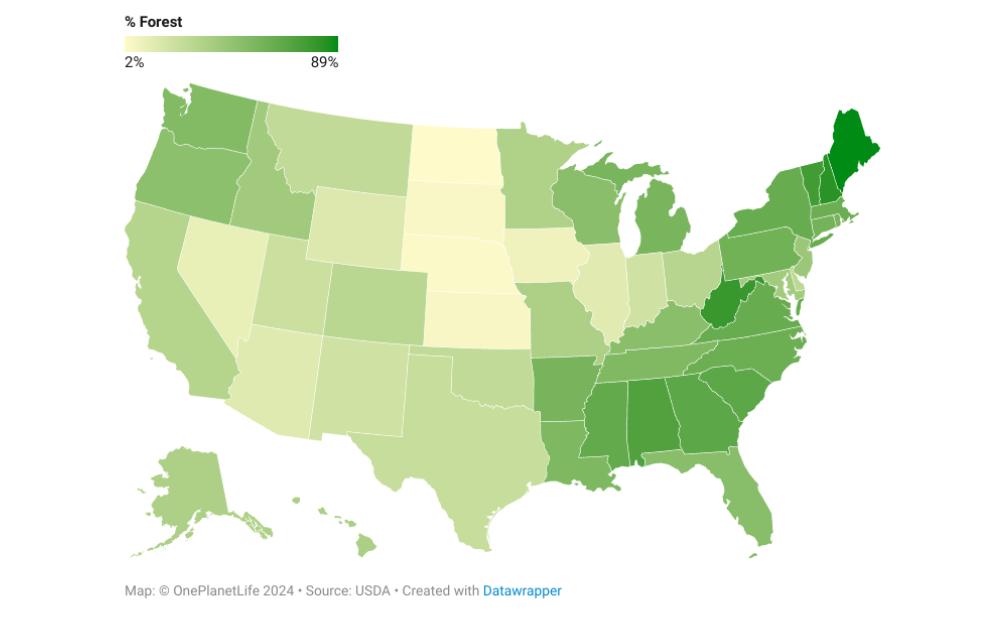
Tree Cover by U.S. State
Trees are a rich resource that provides oxygen, stores carbon, provides shade, and stabilizes soil. Forests and woodlands also support animal life, provide building materials, and even have medicinal properties. Restoration of trees is one of the most effective strategies for climate change mitigation. Explore tree coverage across the United States with our interactive map.
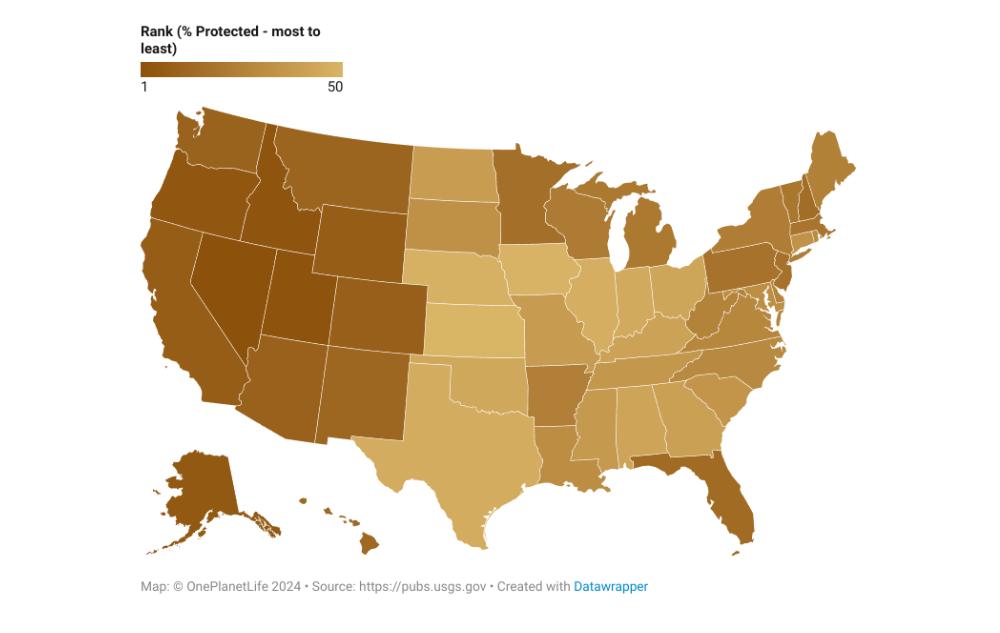
Protected Land by U.S. State
The United States has 63 parks that carry the “national park” name, but there are 431 national park sites across the nation. The United States protected areas are controlled by different federal, state, tribal, and local level authorities and receive widely different levels of protection. Some are managed as wilderness while others allow commercial exploitation operations. Explore our interactive map to discover notable parks and protected land by state, and which states have the most protected land.
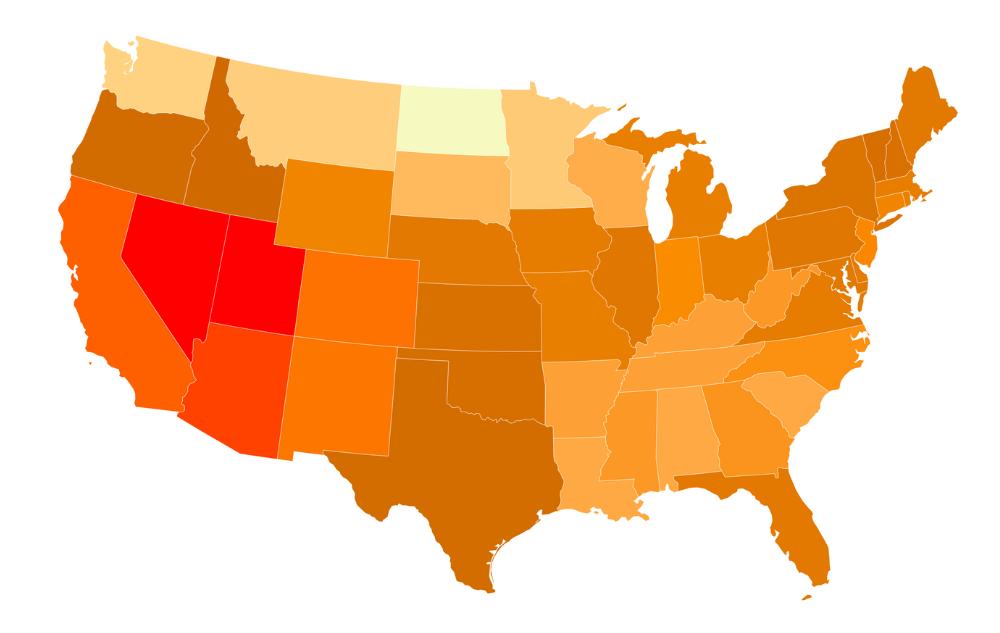
Temperature Anomalies by US State - June 2024
Temperature anomalies measure how current temperatures differ from historical averages. They help us understand which U.S. states are impacted the most by rising heat caused by climate change. Check out our OPL Insight to learn more about Earth’s natural cooling and warming cycles and how high temperatures are affecting our health.
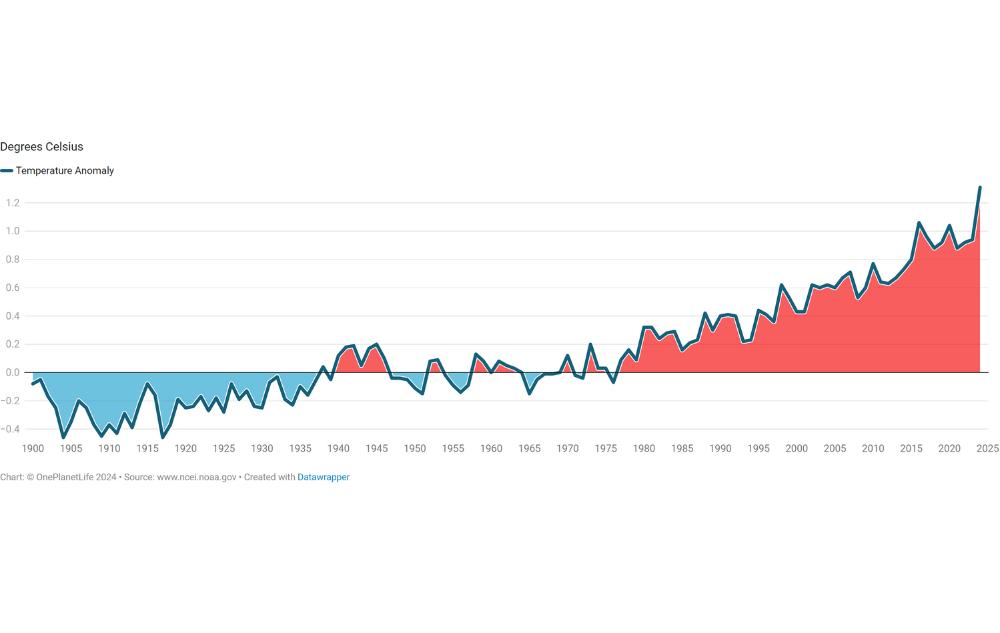
Global Land and Ocean Average Temperature Anomalies
Studying temperature anomalies is the best way to understand the effect climate change has on our warming planet. Explore how climate change has led to rising heat indexes that are detrimental to our Earth and our health. We must combat climate change for Earth and humanity’s survival.
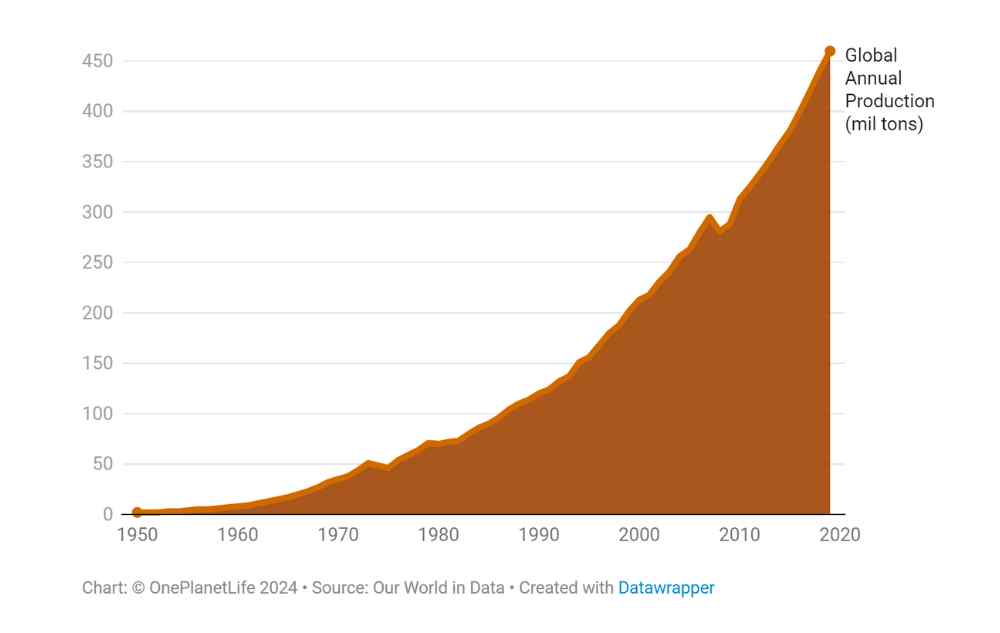
Global Plastic Production 1950-Today
Plastic production has skyrocketed since the 1950s, outpacing any other manufactured material. Learn more about the effects plastic has on our environment, and its devastating consequences if we don’t curb our plastic usage.
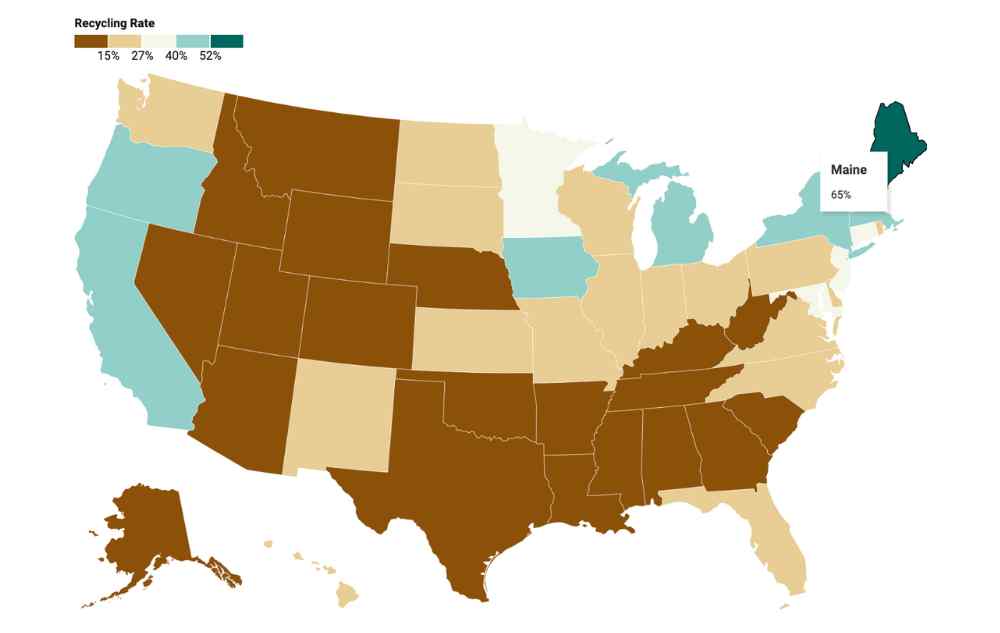
US Recycling Rates by State
America’s recycling programs divert $2.6 billion worth of products from landfills annually. The chart above represents the total amount of plastic that is succesfully recycled and re-incorporated into new products, not products collected. Explore plastic’s history and discover the states leading the country’s recycling programs.
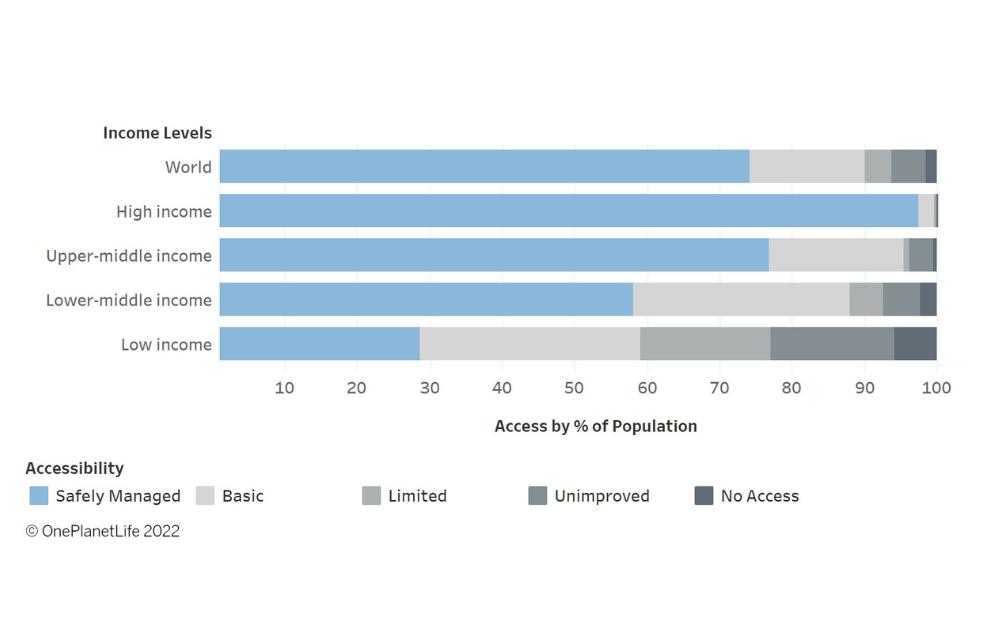
How Income Impacts Water Access
A shocking 26% — nearly 2 billion people — do not have access to safely managed water, and 46% lack access to basic sanitation. Read our OPL Insight blog to learn more about water inequality and its causes.
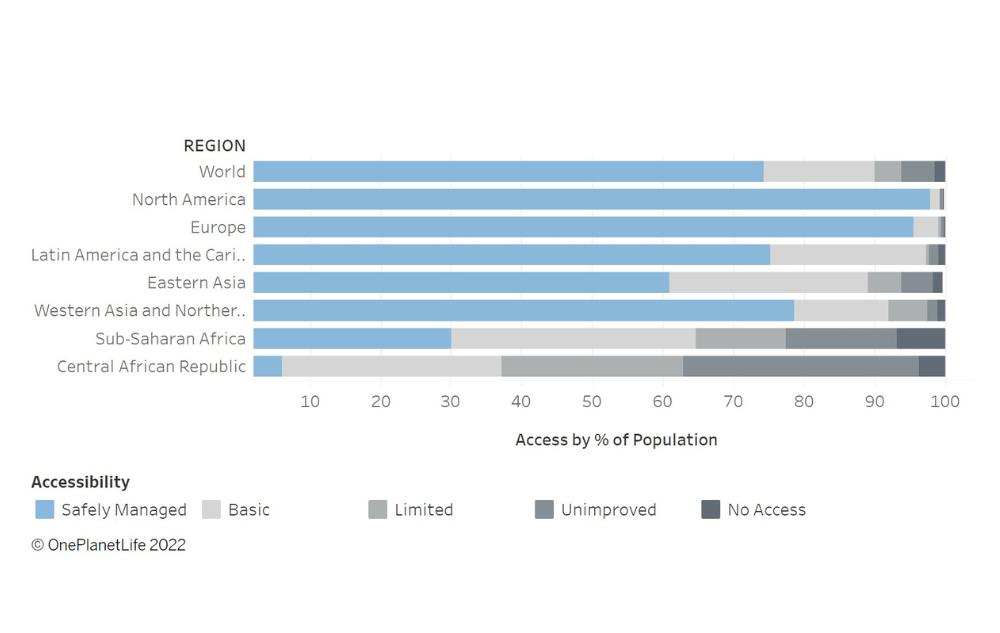
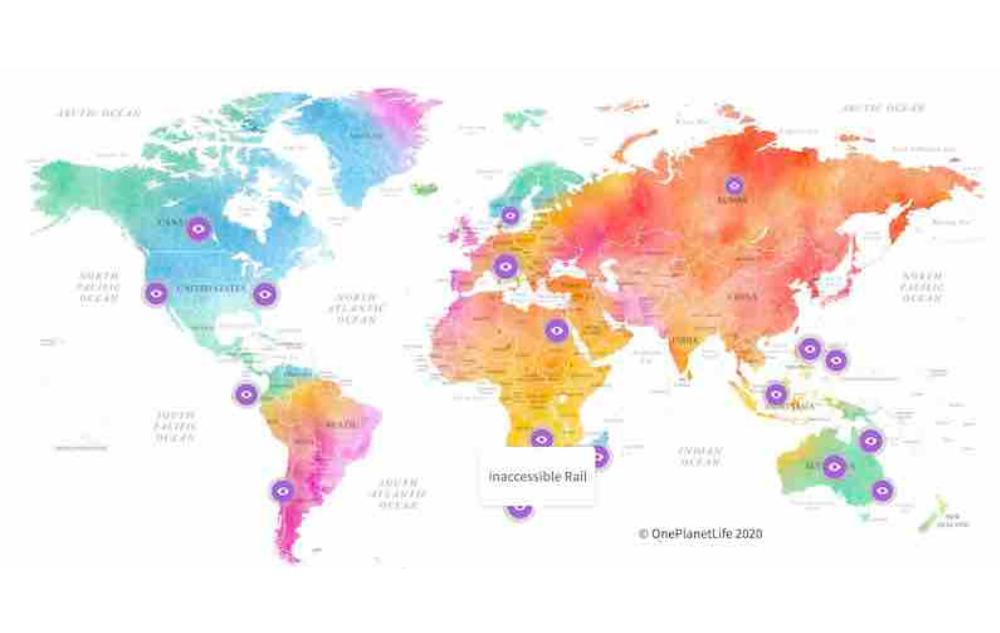
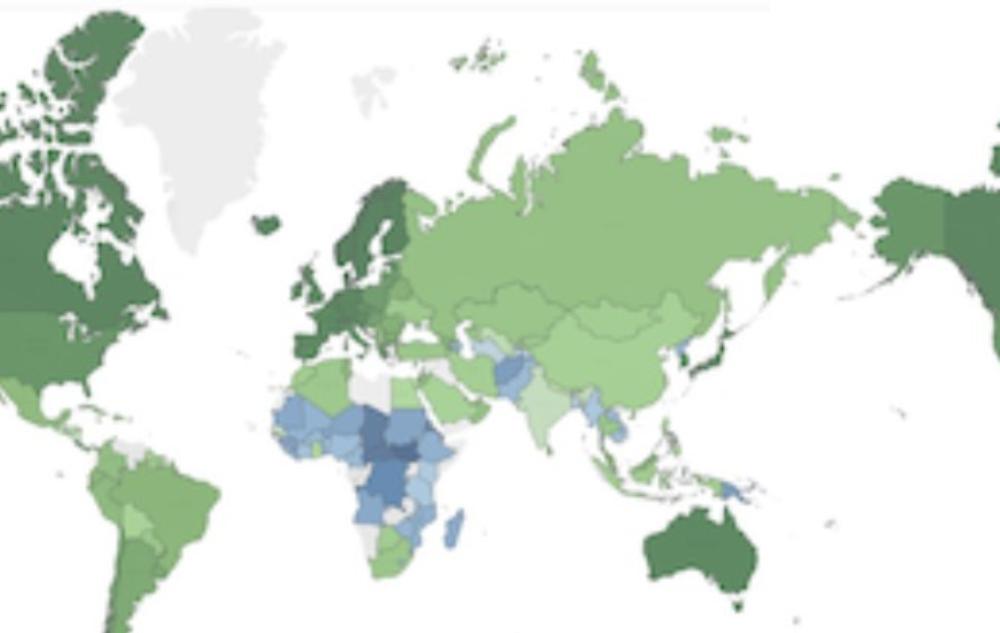
Water Accessibility Around the Globe
Not everyone has instant access to water. Depending on where you live, you could be 30 minutes away from your nearest source. Explore water accessibility around the globe, and understand our current environmental and humanitarian water crisis.
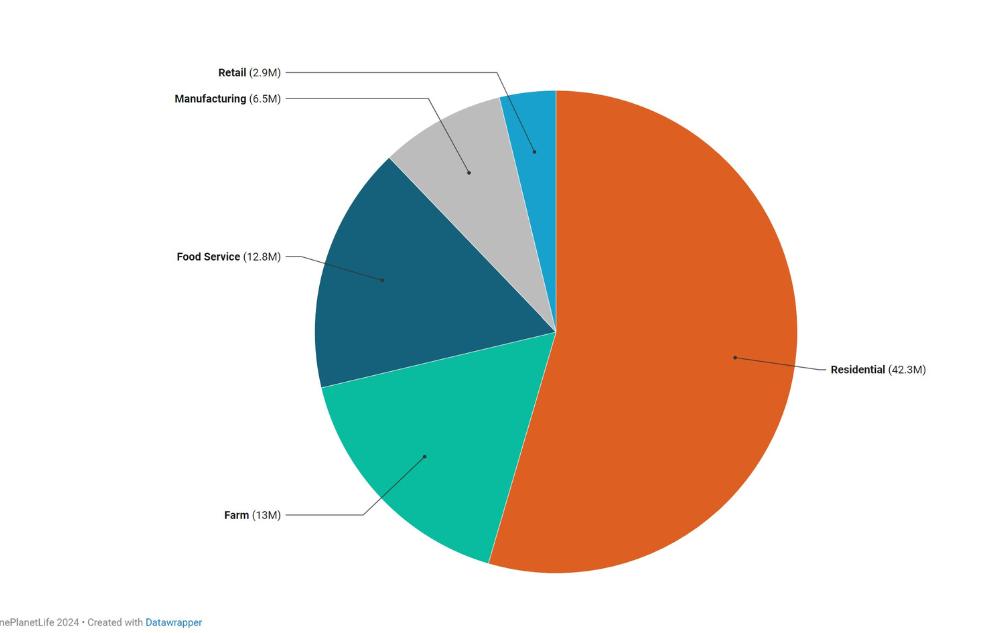
Food Waste by Sector
Food waste management is a crucial factor in our fight against climate change. Gain a better understanding of where most food waste occurs in America. Then read our blog to learn what you can do about it.
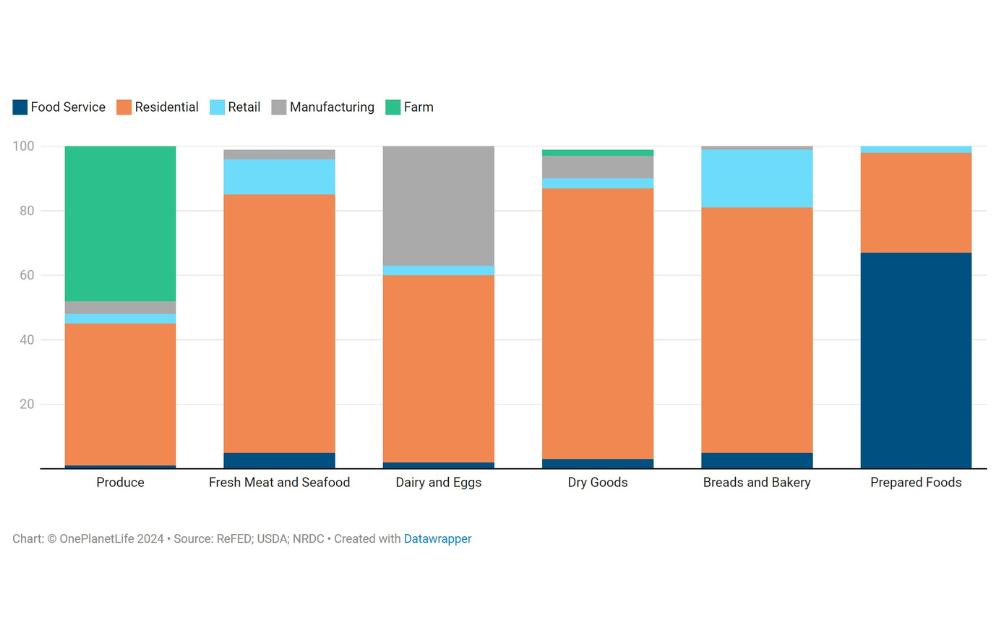
Food Waste by Category and Sector
In America, 30-40% of produced food is never consumed. Discover which sector creates the most food waste for each food type. Then take a deeper dive to understand how global food waste is a major contributor to our climate crisis.
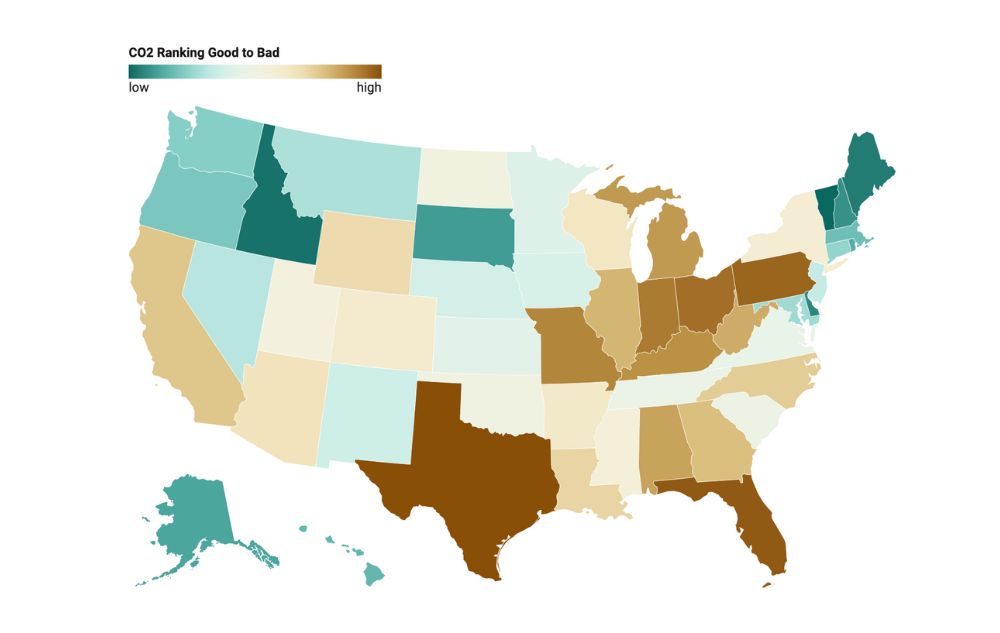
How Healthy Is Your State?
Data Insights into Five Key Climate Issues
One Planet Life has analyzed and compiled data on each state’s CO2 emission, air quality, water quality, waste, and overall pollution. We then ranked each state on a scale of 1 (sustainable) to 50 (least sustainable). See how your state rates.
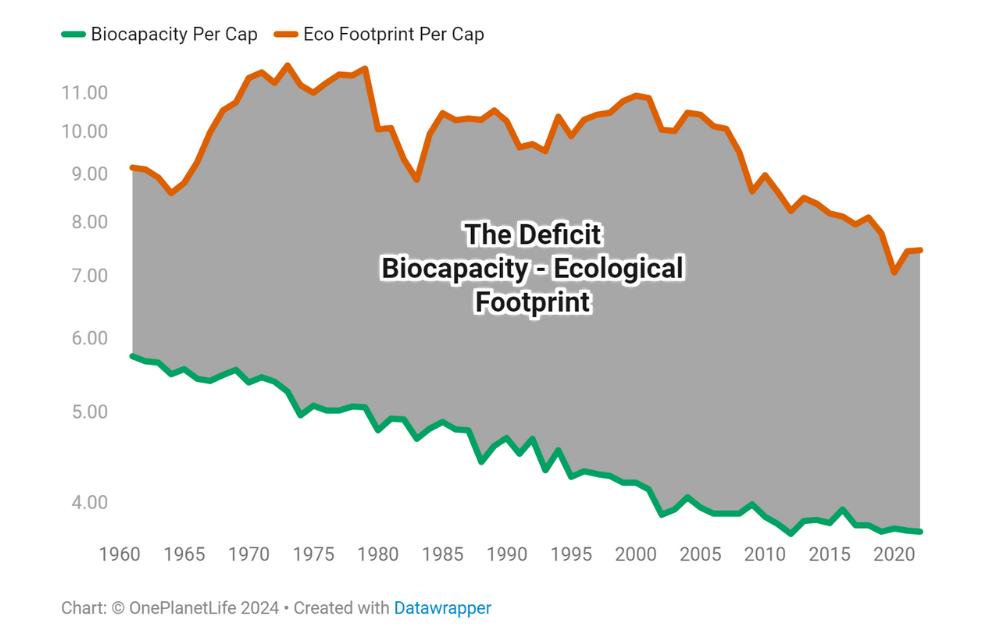
The Ecological Deficit of the United States
Earth Overshoot Day measures the health of our planet against our carbon footprint, but each country and region has its own national deficit or reserve. As of 2024, the United States has a national biocapacity deficit of 110%. This means the United States’ ecological footprint is over twice its national biocapacity. Learn more here.
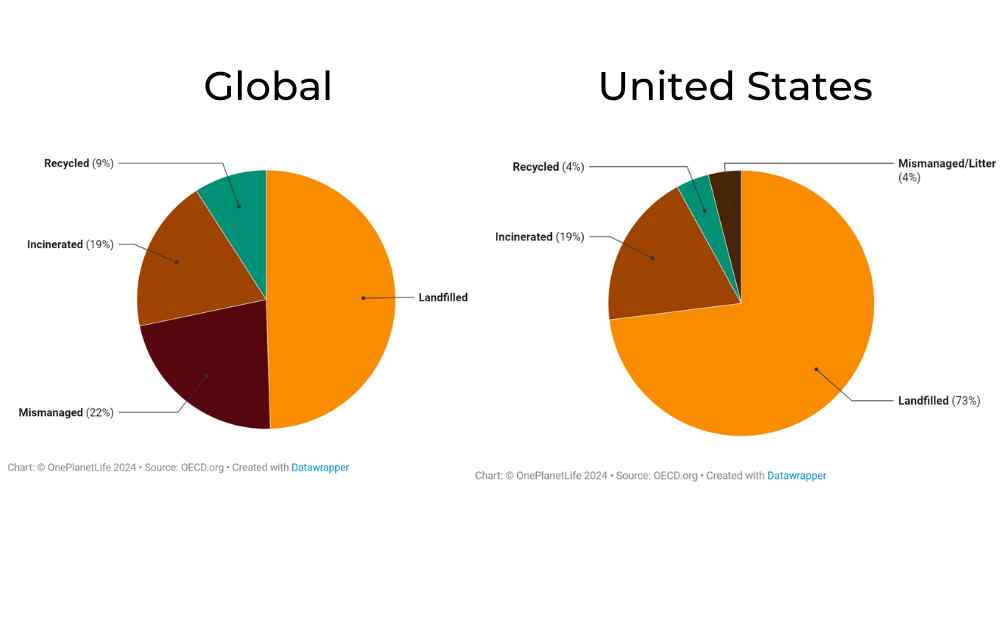
Plastic Waste Management
Too much of the plastic we produce ends up in a landfill. Sadly, only 9% of plastic gets recycled globally. In the United States, the share of plastic waste that gets recycled is even lower, with 73% of plastic ending up in landfills. Explore our insight to better understand the rise of plastic, how plastic waste is managed, and recycling rates by state.
MORE INSIGHTS
One Planet Life values reputable data and analytics to help us better understand our world and our place in it. We invite you to explore these additional resources and learn more about the planet we call home.
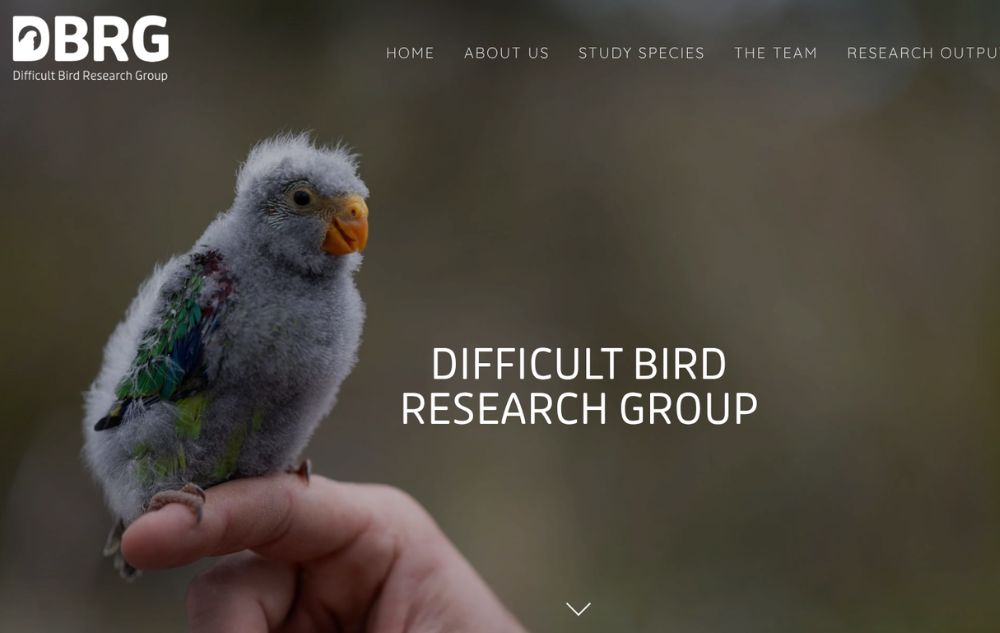
Difficult Bird Research Group
Located at the Australian National University, the Difficult Bird Research Group is committed to the study and conservation of endangered bird species. They also specilize in studying hard-to-find, migratory, and birds that live in difficult wild terrain. Their research focuses on understanding the processes that threaten endangered birds. They seek to identify the ways that humans can intervene to prevent extinction.
Connect with the Difficult Bird Research Group on Instagram and learn more about the unique, “difficult” birds they’re learning about!
Shark Finder
OCEARCH’s mission is to accelerate the ocean’s return to balance and abundance. They use a data-centric approach to track sharks and other large sea life to help scientists collect previously unattainable data in the ocean. You can also learn from this science and follow your favorite shark, sea turtle, etc. Get started on their website below or download their app.
Download the OCEARCH app. It is a free and easy way to stay up to date on all the exciting science at OCEARCH. Track your favorite sharks in real-near time on any of your mobile devices.
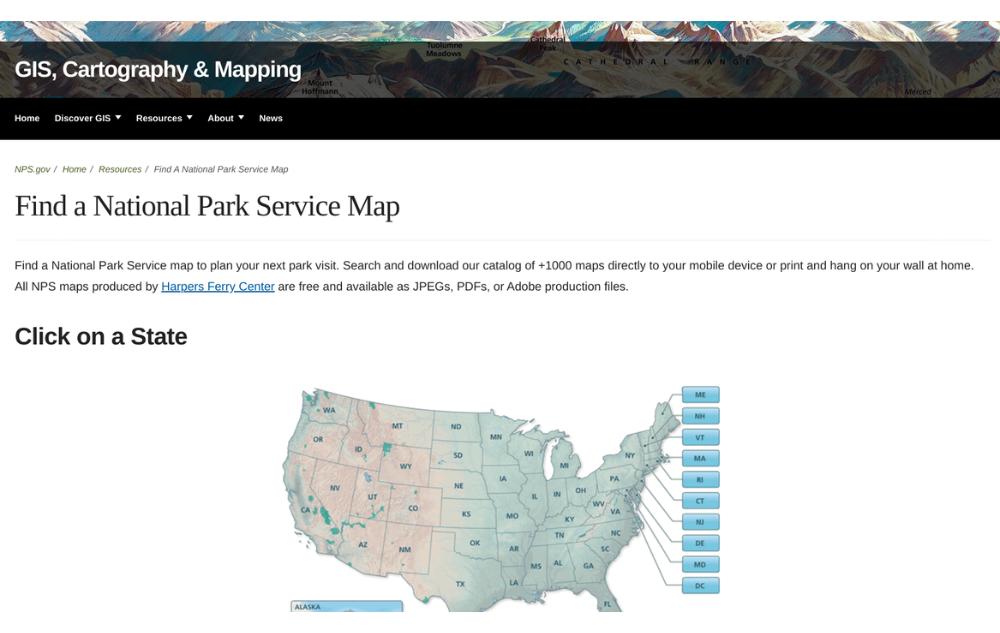
Find a National Park Service Map
Never get lost in a national park again! Use the National Park Service’s interactive map to find national park maps near you. Users can search and download NPS’ catalog of +1000 maps directly to your mobile device or print them out to take on your adventures.
Old-Growth Forest Network
The Old-Growth Forest Network is America’s only national network of protected, old-growth, native forests. They are passionate about preserving woodlands where people of all generations can experience biodiversity and the beauty of nature.
Global Forest Watch
Interested in learning where forests are and how they are changing around the world? Check out Global Forest Watch (GFW), which is a near real-time platform that provides data and tools for monitoring forests globally. Keep track of changes to forests, land coverage, and land usage, as well as the impact forest coverage has on climate change and biodiversity. Explore their maps and dashboards or download the Forest Watcher app for immediate access anytime.
Find a B Corporation
Finding sustainable companies to support isn’t always easy. But BLab solves that! BLab is a non-profit network commited to transforming our global economy to benefit our society and our planet. Their list of certified B Corporations meet rigorous qualifications to certify each company’s social and environmental impact. Find a B Corp near you today and support sustainable businesses.
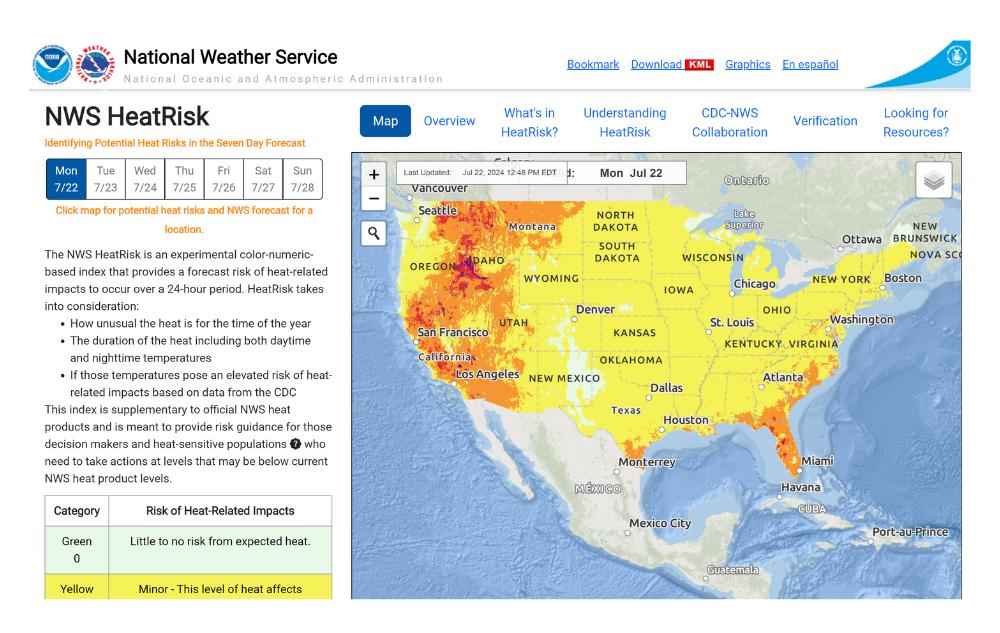
National Weather Service's HeatRisk Tool
The HeatRisk tool, provided by the National Weather Service, was developed by U.S. public health and climate experts to track dangerous heat up to a week out. Check out their site to better understand dangerous heat conditions in your area.
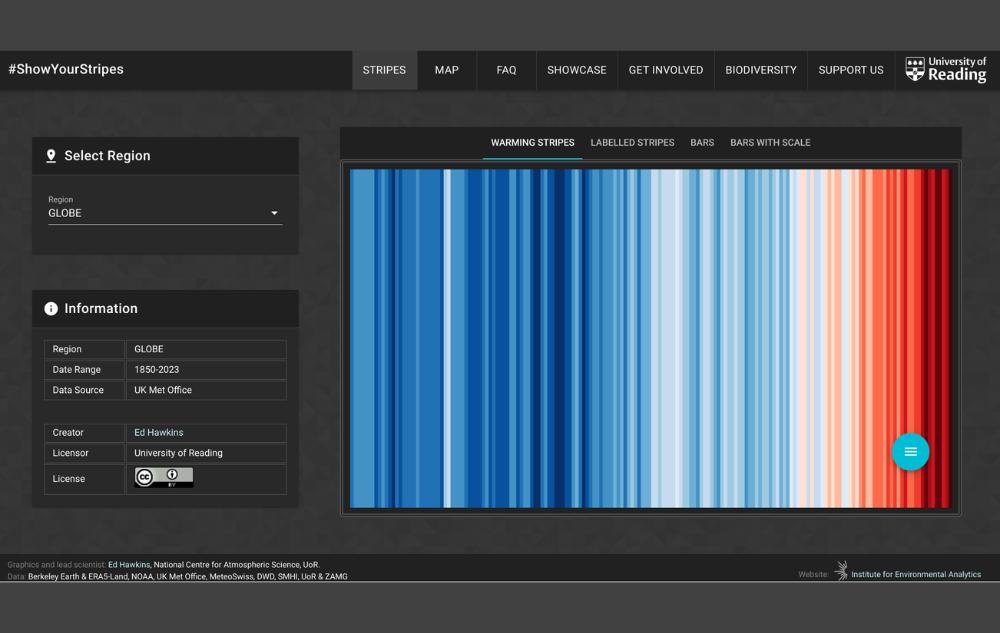
Warming Stripes
Ed Hawkins, professor and climate scientist at the University of Reading, created the “Warming Stripes” chart to visually represent how temperatures on Earth have fluctuated since the 1850s. Discover warming stripes across the globe on the ShowYourStripes website.
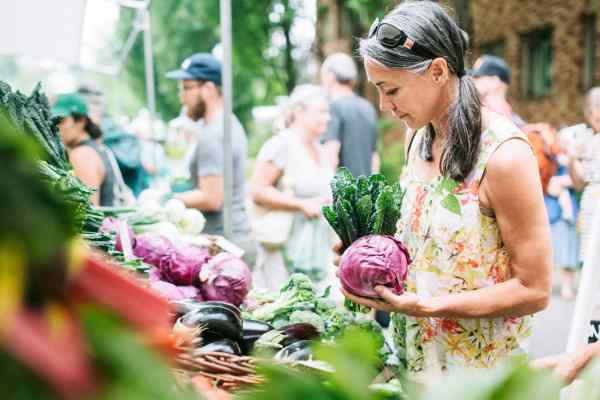
USDA's Local Food Directories
Local food is tastier and more nutritious than grocery store produce. Support your local farmers and establish a deeper connection to your community by shopping local. Use the USDA’s local food directories to find farmers’ markets, CSAs, and agritourism in your area.

United States Refill Store Directory
Get the products you love without negatively impacting the planet. Refill stores allow customers to shop more sustainably by allowing them to bring their own empty glass or plastic containers to be refilled. Use this helpful directory to find a refill store near you.
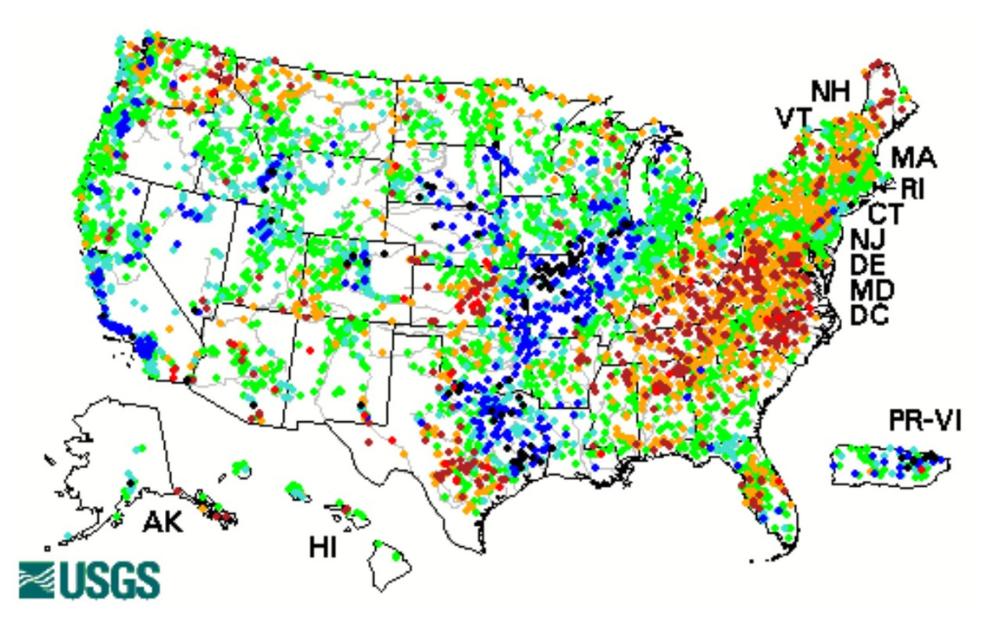
Water Usage in the United States
The United States has large variances of water withdrawal between its states. This variance can depend on a range of factors, including latitude, climate, and the importance of a region’s agricultural or industrial sector.
On the state level, more than 50% of total withdrawals in the U.S were attributed to 12 states: California, Texas, Idaho, Florida, Arkansas, New York, Illinois, Colorado, North Carolina, Michigan, Montana, and Nebraska.
Explore the United States’ Geological Survey (USGS) maps for detailed information about water data in your area.
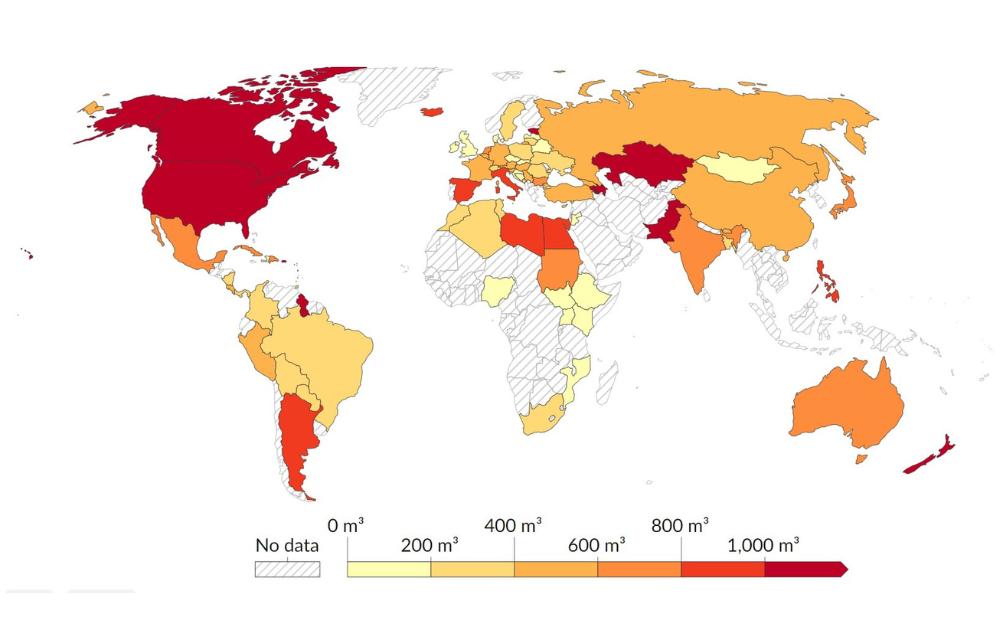
Water Usage Around the World
Water usage varies significantly around the world. The United States is one of the greatest water users per capita in the world, with the average American using about 1,500 cubic meters per year.
Delve deeper into global water usage data, provided by OurWorldinData.
Social Progress and Happiness
We dream of a world where people and the planet come first. To explore where we are today, we looked to social progress and happiness. The Social Progress Imperative developed an index to measure society’s quality of life, independent of economic measures. When coupled with the World Happiness Report, we can begin to sketch a global picture of social progress and happiness around the world. Explore the Social Progress Imperative’s interactive map to learn more.
How Much Water Do You Use?
Discover your water footprint! The Grace Communication Foundation (GRACE) developed this easy to use Water Footprint Calculator. Quickly calculate your usage of blue water, green water, grey water, and virtual water. Unseen water usage, or virtual water, is the water it takes to grow our food, make electricity, and manufacture home goods.
Jump in and see how you can make a difference by reducing your water usage! Even small changes make a big difference.
Our Newsletter